
Being a data analyst isn’t just about theory. It’s about applying knowledge through data analytics tools that companies use every day. Students who master the right tools don’t just look good on paper—they become immediately valuable to recruiters.
Think of it like carpentry: knowing how to cut wood is one thing, but having the right saws and drills makes you job ready. Similarly, tools like Excel, SQL, or Power BI are the “drills” of analytics.
The 6 Best Data Analytics Tools for 2025
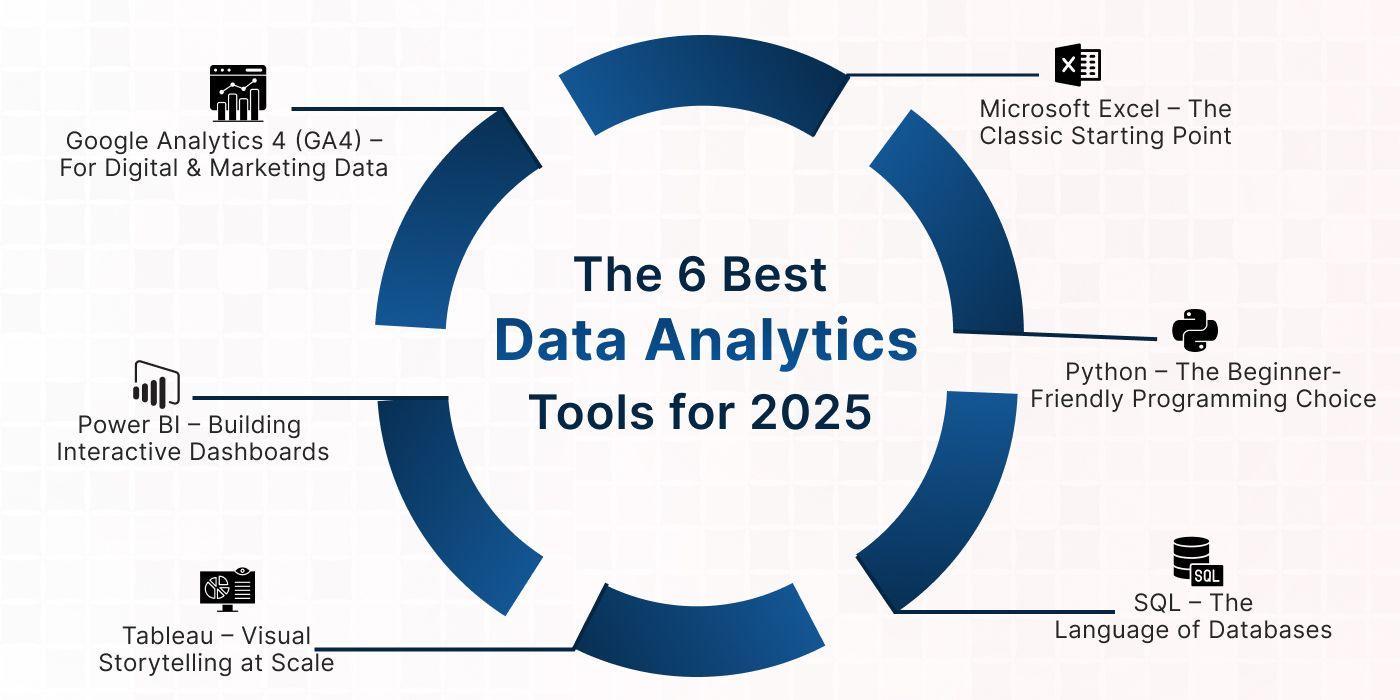
1. Microsoft Excel – The Classic Starting Point
- Still the most widely used tool in companies.
- Great for data analyst prerequisites like pivot tables, VLOOKUP, and dashboards.
- Example: A fresher analyzing monthly sales data in Excel can quickly show growth trends.
2. SQL – The Language of Databases
- Employers often test SQL queries in interviews.
- Used to extract and manipulate large datasets directly from company databases.
- Example: Writing a query to find “top 10 customers by revenue” in seconds.
3. Python – The Beginner-Friendly Programming Choice
- Helps in advanced analytics beyond Excel/SQL.
- Libraries like Pandas and NumPy simplify cleaning large datasets.
- Example: Using Python to clean messy data collected from multiple branches.
4. Power BI – Building Interactive Dashboards
- Microsoft’s tool for data visualization.
- In high demand among recruiters because of its integration with Office tools.
- Example: Creating a regional sales dashboard that updates automatically every week.
5. Tableau – Visual Storytelling at Scale
- Another powerful visualization tool, especially for big companies.
- Lets you drag and drop to create charts and dashboards.
- Example: Showing a CEO “customer churn rate by quarter” in a visually appealing chart.
6. Google Analytics 4 (GA4) – For Digital & Marketing Data
- With businesses shifting online, GA4 is essential for analyzing website and app data.
- Example: A student intern analyzing website traffic sources to recommend marketing strategies.
Student Story: Aman’s Tool Journey
Aman, a BBA student from Chandigarh, joined a data analyst training and placement program. Initially, he only knew Excel. Over 6 months, he learned SQL, Python, and Power BI.
During his placement project, he built a dashboard showing hospital patient trends. His recruiters were impressed with his ability to connect SQL queries with Power BI dashboards. Aman got hired at ₹5 LPA—proof that mastering tools is the fastest route to a strong career.
How Students Should Learn These Tools
Learning data analytics tools is not about cramming everything at once—it’s about building skills step by step. Think of it like climbing a staircase: each tool prepares you for the next level. If you rush to advanced tools without mastering the basics, you’ll quickly feel stuck. That’s why students need a structured path to progress from simple concepts to advanced applications.
Start Simple: Begin with Excel and SQL
The journey usually begins with Excel because it is the most accessible tool. Almost every student is already familiar with Excel from their college projects, but as a data analyst, you need to go beyond basic tables. Features like pivot tables, formulas, charts, and dashboards form the foundation of analytics thinking. Recruiters often ask freshers to show trends, calculate growth rates, or create quick dashboards in Excel because it demonstrates their comfort with everyday business data.
Alongside Excel, students should start learning SQL (Structured Query Language). SQL is one of the most important data analyst prerequisites, as it is used in interviews and daily work. Companies store large amounts of structured data in databases, and SQL helps analysts extract, filter, and analyze it efficiently. For example, a student can use SQL to answer questions like: “Who are the top 10 customers this quarter?” or “Which product category had the highest revenue last year?”
By starting with Excel and SQL, students not only gain confidence but also build a foundation strong enough to take on advanced tools later.
Move to Python
Once comfortable with Excel and SQL, students should upgrade to Python. Python is not just another programming language; it is the bridge between basic analysis and advanced data-driven insights. It is widely used because of its simplicity and its powerful libraries like Pandas, NumPy, and Matplotlib.
For a beginner, Python makes it easier to clean messy datasets, automate repetitive tasks, and perform more advanced analysis that Excel can’t handle. For instance, while Excel might struggle with millions of rows, Python can manage them with ease. This is why Python has become a must-have skill in most data analyst requirements.
If you’re aiming for long-term growth in analytics, Python also prepares you for future transitions into machine learning or data science. That’s why most data analyst training and placement programs include Python after Excel and SQL.
Visualize Data: Practice Dashboards with Power BI or Tableau
Data is useless if it can’t be communicated clearly. This is where visualization tools like Power BI and Tableau come in. Both tools allow students to turn raw data into interactive dashboards that decision-makers can understand easily.
For example, instead of sharing rows of numbers, you can create a Power BI dashboard that shows sales growth across regions in colorful, interactive charts. Tableau, on the other hand, is known for its ability to handle very large datasets and create visually appealing charts.
Employers in India often prefer Power BI due to its lower cost and integration with Microsoft tools, but having exposure to both is an added advantage. Visualization tools are critical to meeting modern data analyst requirements, because they prove you can not only analyze data but also explain it in business language.
Explore Web Data: Learn Basics of GA4 for Digital Analytics
With most businesses moving online, students should also be familiar with Google Analytics 4 (GA4). GA4 is the standard tool for tracking website and app performance. Even basic knowledge of GA4 can make a student stand out, especially in marketing and digital roles.
For example, you might be asked to analyze where website visitors are coming from—social media, ads, or search engines—and recommend which channel deserves more budget. With GA4, you can easily create such reports. This additional skill enhances your resume and shows versatility.
Apply in Projects: Build a Mini-Portfolio
Tools are valuable only if you can apply them. Students should practice by working on mini-projects and showcasing them on GitHub or LinkedIn. A project could be as simple as creating an Excel dashboard of monthly expenses, analyzing sales with SQL queries, or building a Power BI dashboard for a small dataset.
Over time, these projects form a portfolio that recruiters can actually see. When applying for jobs, having a portfolio speaks louder than a certificate. It demonstrates that you have not just learned tools, but also applied them to solve problems.
Join Placement Programs
Finally, while self-learning is good, students aiming for jobs should consider joining the best data analytics courses in India with placements. These structured programs teach tools in the right order, provide mentorship, and offer exposure to live projects. More importantly, they connect students directly with recruiters.
For example, many institutes in Chandigarh and Mohali include mock interviews, resume workshops, and placement drives as part of their data analyst training and placement programs. Students who meet the data analyst prerequisites and go through these structured pathways often secure jobs faster, with packages close to the industry average.
Final Thoughts:
In essence, the secret to mastering data analytics tools lies in structured learning: start with Excel and SQL, add Python, practice visualization, explore GA4, and apply everything in projects. Then, bridge the gap between knowledge and employment with placement programs.
This step-by-step approach ensures you don’t just “know” tools—you use them to become job-ready, confident, and in demand for 2025 and beyond.
Click here to master the right tools, build real projects, and step into your data career with confidence.