
If you’re considering a data analytics course in India, you’re probably asking one of these questions:
- What should I learn first—Excel, SQL, or Python?
- How do I become job-ready without experience?
- What do recruiters actually test in interviews?
This guide is written from a student’s perspective: practical, tool-first, and focused on building proof (projects + portfolio), not just finishing a course.
What is data analytics?
Direct answer: Data analytics is the process of turning raw data into clear insights that support decisions—using analysis, basic statistics, and reporting.
A typical entry-level role includes:
- Cleaning and validating data
- Writing queries to pull data
- Summarizing patterns (what changed, why it changed)
- Building dashboards or reports
- Explaining results in a simple, structured way
What is the average salary for a data analyst in India?
Direct answer: Recent public estimates put the average base pay for a data analyst in India in the mid–single-digit LPA range, with variation by city, company, and skill stack. Glassdoor+1
For context, Glassdoor’s India estimate shows:
- Average: about ₹6.6 LPA
- Typical range (25th–75th percentile): roughly ₹4.4 LPA to ₹10 LPA Glassdoor
Indeed reports a similar national average estimate based on recent reported salaries. Indeed
Note: Salaries move with market conditions, and the biggest driver for freshers is not the certificate—it’s whether you can show practical proof of work.
Why a data analytics career makes sense in 2026
Direct answer: Analytics is a strong entry career because most companies need reporting clarity, and hiring often rewards practical skills over formal credentials.
Why students choose it:
- Clear learning path: you can progress from basics to projects step-by-step
- Industry flexibility: roles exist across tech, retail, finance, healthcare, and operations
- Fast “proof building”: projects and dashboards are easy to showcase publicly
Step 1: Build the foundations (before tools)
This is where data analyst prerequisites matter most.
Direct answer: Strong basics make tools easier: logical thinking, comfort with numbers, and clear communication.
Key data analyst prerequisites
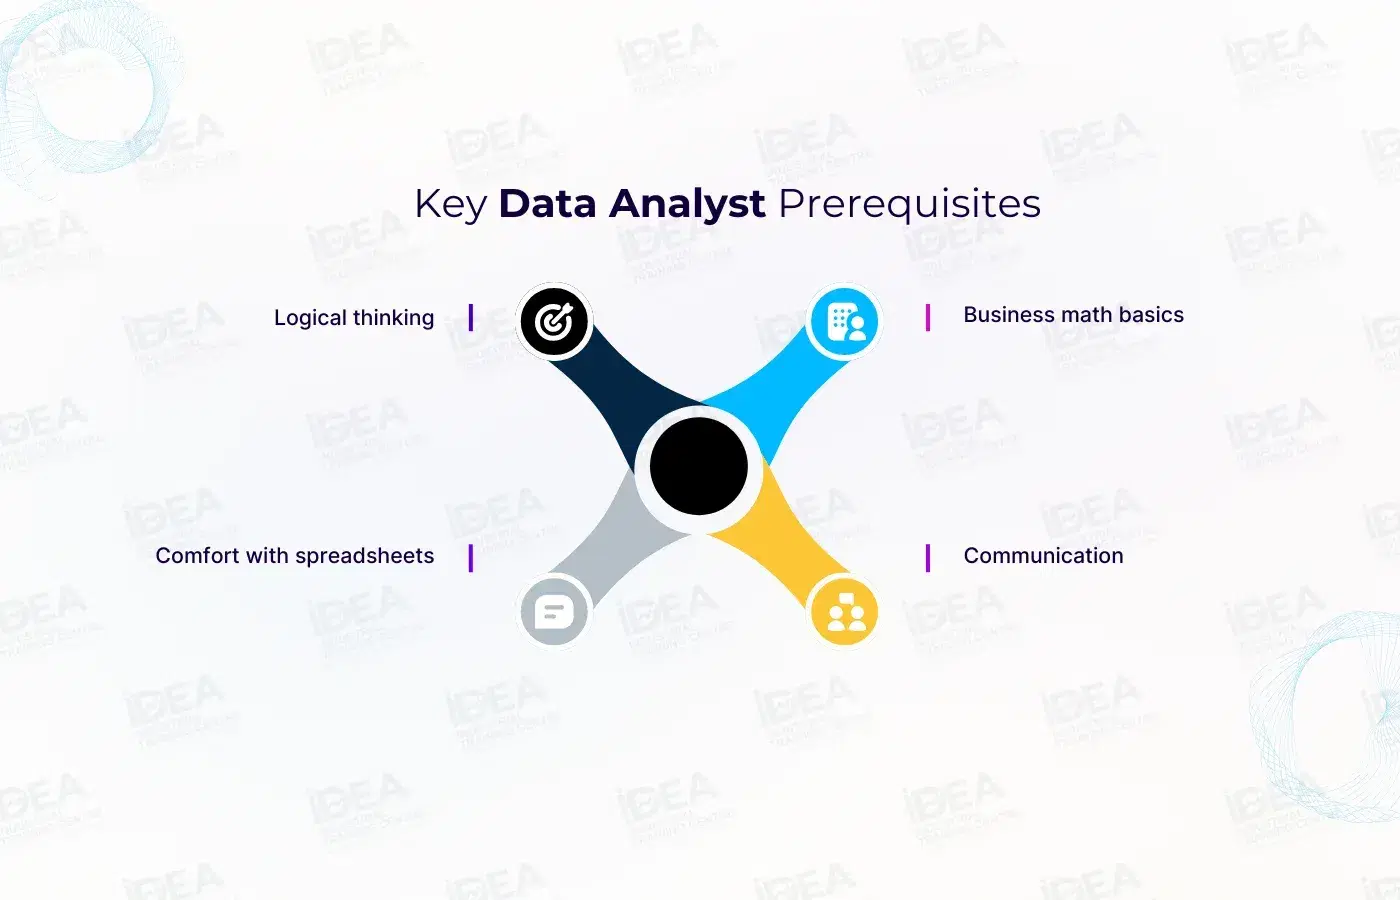
- Logical thinking: breaking a question into steps
- Business math basics: percentages, averages, trend comparisons
- Comfort with spreadsheets: sorting, filtering, simple formulas
- Communication: explaining insights in 30–60 seconds without rambling
If these are weak, students often “learn tools” but still struggle in interviews.
Step 2: What recruiters actually expect (the real checklist)
This is where data analyst requirements come in.
Direct answer: Recruiters typically check SQL fundamentals, one dashboard tool, basic analysis skills, and your ability to explain a project clearly.
Common data analyst requirements
- SQL: joins, group by, window functions, filtering logic
- Excel: quick analysis + cleanup
- Dashboarding: Power BI or Tableau (one is enough to start)
- Project proof: 2–3 projects with screenshots, links, and a short summary
- Explanation skills: what you did, what you found, why it matters
The tool stack students should learn (in the right order)
This guide uses the term data analytics tools only in a practical way: what helps you get hired faster.
Direct answer: Learn tools in layers—start simple, then add power.
1) Excel (start)
Use it to learn basic patterns: trends, variance, simple summaries.
Best student outcome: a clean spreadsheet + a one-page summary of insights.
2) SQL (daily driver)
SQL is the fastest way to work with real company data.
Best student outcome: 10–15 reusable queries + confidence with joins and grouping.
3) Power BI or Tableau (show your work)
Dashboards make your work visible and easy to evaluate.
Best student outcome: one dashboard with 5–8 KPIs and drill-down filters.
4) Python (scale)
Python helps you clean, merge, and automate repeat analysis (especially with larger datasets).
Best student outcome: one notebook that cleans messy data and produces a clear output table.
You do not need to learn everything at once. Most students fail by switching tools too often without finishing projects.
A 6-month roadmap (student-friendly)
Direct answer: A focused six months is enough to become interview-ready if you build projects alongside learning.
Month 1: Excel + fundamentals
- pivot tables, common formulas, cleaning
- mini task: “monthly sales trend + top products”
Month 2: SQL foundations
- joins, group by, common filters
- mini task: “top customers + repeat customers + region performance”
Month 3: Dashboarding (Power BI/Tableau)
- KPI cards, slicers, drill-down pages
- mini task: “sales dashboard with weekly view”
Month 4: Python basics (optional but valuable)
- reading files, cleaning, merging
- mini task: “combine multiple CSVs into one clean dataset”
Month 5: Build 2 complete projects
- choose simple business questions
- publish: screenshots + short explanation
Month 6: Interview + portfolio
- daily SQL practice
- project walkthrough practice
- resume + LinkedIn rewrite focused on proof
Projects that actually make you “hireable”
Direct answer: The best projects are simple, end-to-end, and easy to explain in a short story.
Three safe project ideas for students
- Sales performance dashboard (Excel + Power BI/Tableau)
- Customer repeat-rate analysis (SQL + visualization)
- Data cleanup + insights notebook (Python)
Project rule: dataset → cleaning → analysis → output → 3 insights → publish.
If your project can’t be explained in 45 seconds, it’s not interview-ready yet.
How to choose the right course (without getting confused)
Direct answer: Pick a program that forces practice, projects, and review—because motivation drops when everything is self-paced.
Look for:
- hands-on assignments every week
- at least 2–3 end-to-end projects
- real interview practice (mock interviews, feedback)
- portfolio building support (how to publish, how to write project summaries)
Avoid programs that are mostly theory, or that only give “tool walkthroughs” without outputs.
Can I start without coding?
Direct answer: Yes. Start with spreadsheets and SQL. Add Python after you can query and summarize data confidently.
Final Thoughts
A data analytics course in India only pays off if it produces outcomes: solid fundamentals, practical data analyst prerequisites, clear data analyst requirements coverage, and visible work samples. If you learn tools in the right order, build 2–3 complete projects, and practice explaining your work clearly, you become employable faster—without relying on luck or generic certificates.
Want a personalized 6-month roadmap based on your current level? Use the Contact Us form on your website to request a callback and share your background (degree + current skills).